
Virtualized environments are complex with many moving parts that include storage, networking, server hardware, hypervisors, and more. If you have ever dealt with an IT technical problem that became a major incident, then you know how complex troubleshooting can become. Then consider a complex problem that isn’t what it seems; where at first glance the problem appears to be one thing, but the resolution is something completely different. The ability to diagnose any kind of problem in your virtualized environment can be challenging. So today. we will dive into an issue from a healthcare organization that started as a problem, became a major incident, then came with a twist of a resolution.
Problem to Major Incident
Healthcare organizations are typically a little bit different than other organizations due to the fact that every action taken from a technology perspective has the potential to impact a patient on the other end. That patient can be impacted in small ways in which they may need to wait longer for care, or it slows down the ability to provide care already in progress. These are frustrating for both patient and the hospital staff. In the most critical of situations, these issues have the potential to impact patient care.
Let’s consider this real-world situation.
Multiple departments in a healthcare organization called in and reported that many of the scanners in the enterprise were scanning very slow. Critical business workflows were impacted, so this was quickly converted to a major incident.
Troubleshooting the Issue
All necessary technical teams quickly assembled to start to diagnose any kind of problem. This included the peripherals team, network team, Citrix team, and the Meditech EMR application team. None of the teams found any problems as they reviewed the situation. Of course, there was a problem somewhere, so the teams continued troubleshooting. After some time, the only real thing they found to try was to update the scanner drivers. After taking the initiative to deploy the updates they aborted this plan. They determined that they needed broad visibility across each of these technical areas with deep metrics to help pinpoint the issue specifically.
Troubleshooting with Visibility into the problem at hand is key to resolution
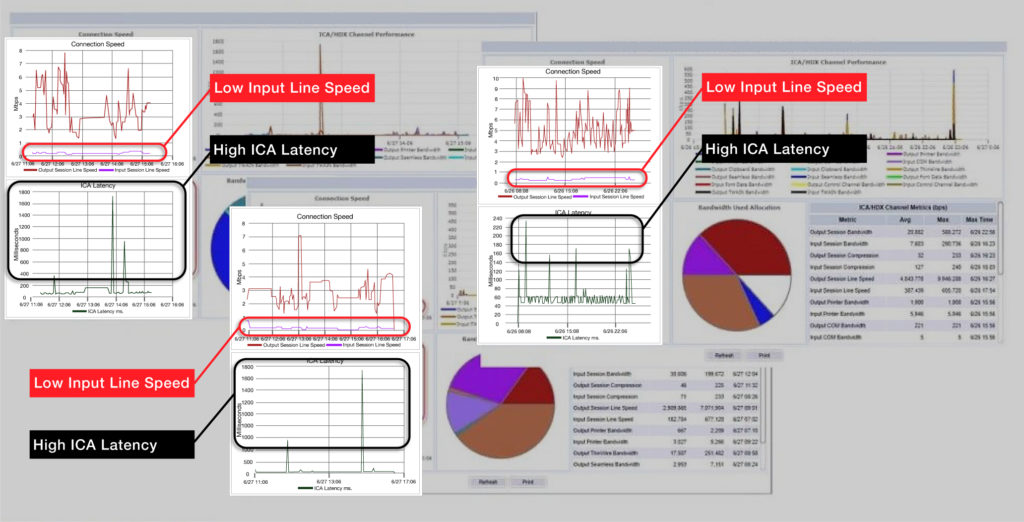
Step 1 – Begin evaluating user sessions reporting the problem with Goliath Performance Monitor. By reviewing detailed metrics from the entire Citrix XenApp infrastructure, they quickly documented the issue impacting end users. Figure 1 below shows 3 different user sessions where the input line speed is low, but the ICA latency is high.
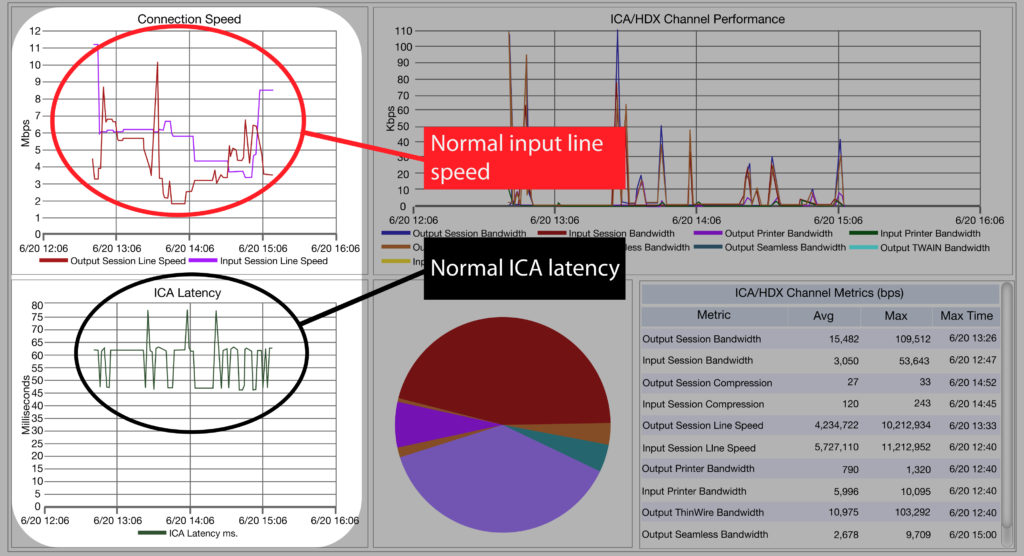
Step 2 – Goliath maintains detailed historical metrics, not summaries. This allowed further research to confirm that there were not any session latencies in the days prior to the incident being reported. Figure 2 below illustrates these findings.
Step 3 – The teams then analyzed all of the data and identified a high ICA latency as shown in Figure 3 below. Then determined there was an issue at the network level related to a change made in the days prior to this major incident that was suspect. The data showing the change in performance was key in pinpointing the issue to a specific set of network changes.
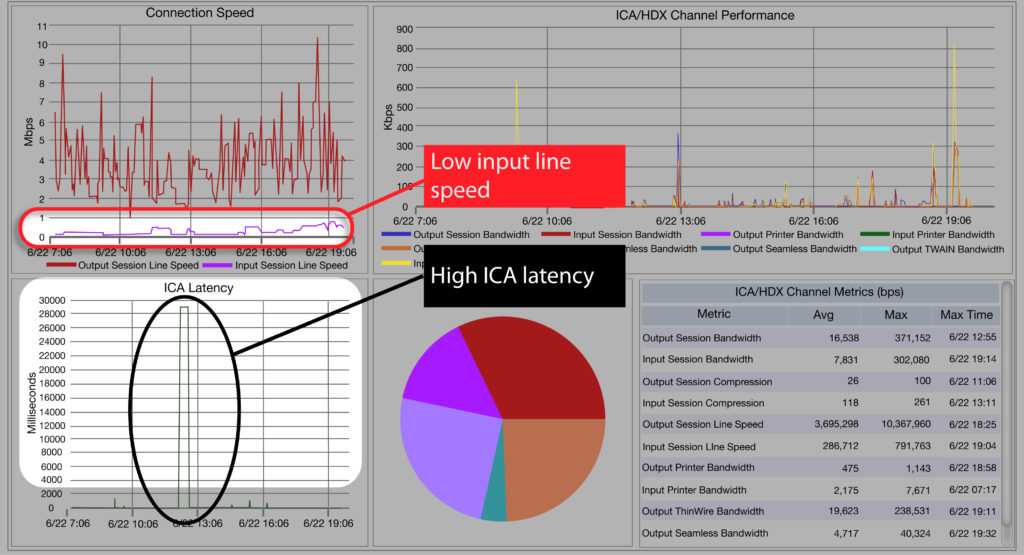
Step 4 – Focus was shifted from the scanners to the MPLS Circuit that had an update applied recently. Goliath Performance Monitor was able to identify that this Circuit was dropping large amounts of packets causing retransmits and slowing network performance. The nature of the data used by scanners made them particularly vulnerable to this condition.
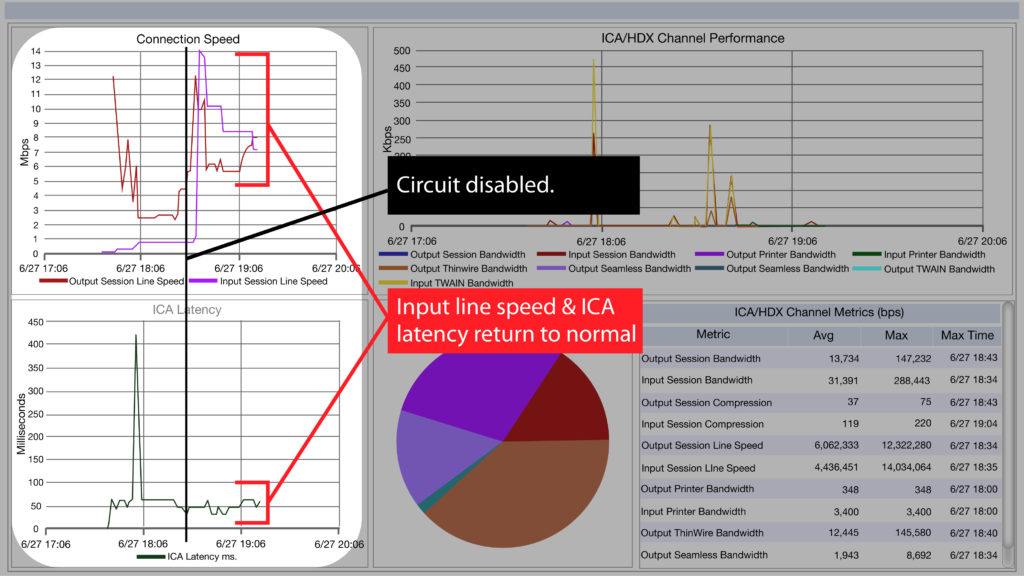
Step 5 – So the circuit was disabled, and the ICA latencies stopped. Figure 4 below shows the performance problems have been resolved with the Circuit disabled – providing proof that the remediation action was successful.
Having the right tools
It’s clear that this team needed the Goliath Performance Monitor to quickly identify and troubleshoot the issue with the scanners being used by the Meditech EMR application. Without it, identification of this issue could have gone on for countless hours. A huge win for any healthcare organization to diagnose any kind of problem in their virtualized environment.
Sponsored by Goliath Technologies
Goliath Performance Monitor’s EHR modules provide a unified view combining performance metrics for the EHR application, End User Experience, and the underlying Citrix or VMware Horizon virtualization delivery infrastructure. This is the only IT operations software with purpose-built technology to integrate these three data sources to help Healthcare IT proactively anticipate, troubleshoot and prevent end user experience issues.
Goliath Performance Monitor is available in the Epic AppOrchard and available for purchase directly from Cerner. Healthcare Modules are available for Epic, Cerner, MEDITECH and Allscripts.
For more information please visit www.goliathtechnologies.com