
It’s just email… Almost every Exchange administrator has heard those words said before. But what happens when email is down or running slow? What do you do to keep running? When a system goes down, it would appear to be as the world has completely ended. In today’s world email is the main form of communication for the majority of businesses. Without email there is loss of productivity which could lead to dollars lost, which in the end is not good.
The key to keeping a healthy Exchange environment, to reduce those outages, keep running, or poor user experiences is daily active monitoring. You want to monitor your active exchange servers and its surrounding infrastructure. Simply turning on monitoring will not get you very far. First question you should ask yourself is “What do I need to monitor?”
There are numerous monitoring solutions for Exchange, some are available for free and some you need to pay for. When you know exactly what are you need to monitor this will help decide on what type of monitoring solution you need.
Performance Monitoring to keep running
Performance monitoring is vital because we need to know how the servers are performing to keep running. When the servers are slow that could impact the user experience. Users hate when their email is delayed. The following performance counters will help you keep an eye on any potential issues that maybe happening or trending to a issue.
Exchange server performance counters
- Memory usage
- Memory\Available Mbytes (MB)
- Memory\Pages/sec
- Memory\Pool Nonpaged Bytes
- Memory\Pool Paged Bytes & Memory\Free System Page Table Entries
- RPC Operations
- MSExchangeIS\RPC Averaged Latency – below 50ms
- DSAccess
- MSExchangeDSAccess Domain Controllers\LDAP Read Time – below 50ms spikes no higher than 100ms
- MSExchangeDSAccess Domain Controllers\LDAP Search below 50ms spikes no higher than 100msspikes no higher than 100ms
- Disk-
- Database disks
- PhysicalDisk\Average Disk sec/Read – less than 20ms
- PhysicalDisk\Average Disk sec/Write – less than 20ms
- Transaction Logs disk
- PhysicalDisk\Average Disk sec/Read – less than 5ms , spikes no higher than 50
- PhysicalDisk\Average Disk sec/Write – less than 10ms, spike no higher than 50ms
- Log buffer
- Database\Log Record Stalls/sec – below 10 per sec no higher than 100 per sec
- Processor –
- Processor\% Processor Time (_Total) , ideally should be less than 90%
- Database disks
You also want to monitor your Transport hub queues to keep running. Typical causes of transport hub queues being backed up is a mail storm. When the Transport hubs are backed up it can cause performance issues on the server and cause emails to be delayed. In addition to the queues you will should also monitor Exchange mailbox health, which includes the mailbox replication and database copy status.
Exchange Queues
- Total Queue count
- Total Queue length
- Total Queue size
- Where is the back up? What is causing it?
Exchange Mailbox health
- Test-MRSHealth – Mailbox Replication Service responsible for processing mailbox moves
- Test-ReplicationHealth – test overall health and replay stats for DAG
- Get-MailboxDatabaseCopyStatus – test to review health of mailbox database copies
Predicting, trending, and keep running…
The whole purpose of monitoring is prevent and fight those issues that cause email delays and outages. Using some of the data that you receive from your monitoring can help you diagnose issues and come to the root cause of those fires we all hate.
Reviewing your application log and your system log should be one of the first troubleshooting steps or in the case of future issues, these would be warnings indicating future issues. If your monitoring tool has the ability you can even trigger it to alert you on specific Event IDs. These Event IDs are the first indications that you may have a possible issue.
An example:
Event ID: 10027 Source: MSExchangeIS –
There are 5 RPC requests for the mailbox “48016d70-fc4e-417f-a68d-bb3199c82a51” on the database “25ac6881-b8d9-469b-a046-4bfa86a5ec07: / o=DOMAIN/ou=Exchange Administrative Group (FYDIBOHF23SPDLT)/cn=Configuration/cn=Servers/cn=XXX-XXXXXXX-XX/cn=Microsoft Private MDB” that have taken an abnormally long time to complete. This may be indicative of performance issues with your server.
If you are seeing a lot of this, Warning! It can be indication you are having performance issues on your Exchange server. If you periodically get the warnings it can be harmless. It means something(s) is taking longer than Windows thinks it should to perform an operation remotely on that mailbox. This can be anything from a search or even mailbox maintenance operations.
When troubleshooting a common but complex issue such as “my email is slow”, always check your performance counters that you are monitoring. These counters will indicate if there’s latency or performance issues. Knowing the right key performance counters to look at you can determine if the issue is Client side or server-side.
Key counters to look at:
MSExchangeIS\RPC Requests – lower than 70 – indicates how many threads are currently in use
MSExchangeIS\RPC Operations/sec– Always higher than RPC Requests – number of operations the server received in the past second.
If MSExchangeIS\RPC Requests is increasing fast and the MSExchangeIS\RPC Operations/sec stays stable this indicates that the server cannot process client operations fast enough or is having performance issues. This points to the exchange server as the source of “my email is slow”. When all RPC threads have been exhausted, clients are not unable to submit new requests to the server until all threads are released.
When MSExchangeIS\RPC Requests and MSExchangeIS\RPC Operations/sec are either low or at zero this indicates that the “slowness” is not caused by the exchange server is most likely an external source such Active Directory, network or even client side issue. You can use additional tools such as EXMon when you’re seeing high RPC request. This tool can actually pinpoint a particular mailbox user is causing trouble and affecting everybody else. A bad mailbox with corrupted items can be located by extremely high RPC requests from the ExMon. You will want to also look at additional counters such as Memory and Disk activity.
For example if the disk performance counters are above the thresholds the exchange server could be suffering from disk issues. You could have failing hardware or simply not enough spindles.
- Disk-
- Database disks
- PhysicalDisk\Average Disk sec/Read – less than 20ms
- PhysicalDisk\Average Disk sec/Write – less than 20ms
- Transaction Logs disk
- PhysicalDisk\Average Disk sec/Read – less than 5ms , spikes no higher than 50
- PhysicalDisk\Average Disk sec/Write – less than 10ms, spike no higher than 50ms
- Log buffer
- Database\Log Record Stalls/sec – below 10 per sec no higher than 100 per sec
- Database disks
If you are seeing high CPU utilization for your Client Access Servers this can also be cause of slowness. The RpcClientAccess.Service.exe process consumes excessive CPU resources can be caused by many things such as bad iOS code on mobile devices to third party archiving software that is integrated with exchange. High CPU utilization on Client Access Servers can cause outlook to be slow for users and may even cause disconnects.
Conclusions are to keep running
Monitoring and Alerting is not full proof and will not protect you from all outages but it can help reduce the amount of outages and keep running. There are many monitoring solutions out in the market, one of them being SolarWinds. Here is an example of how our sponsor SolarWinds, helps troubleshoot complex Exchange problems across the stack with their application monitoring solution.
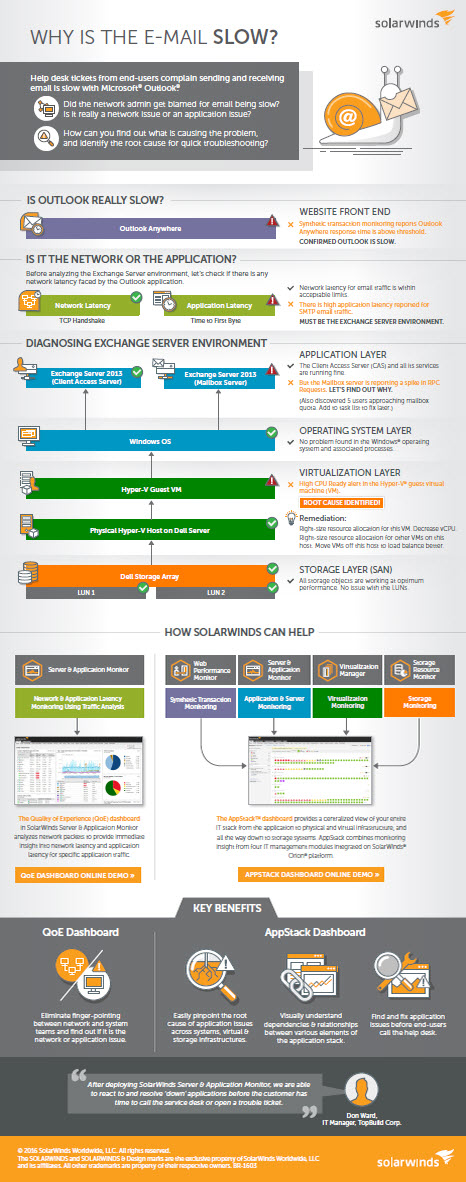
Sponsored by Solarwinds